SOMETHING TO HIDE
Who is working for whom when we accept the deal of providing our data in return for free services, how much of this ‘personal’ data is still ours and who really owns it? Through a series of playful objects this tables invites us to reconsider what we mean when we say we have ‘nothing to hide’.
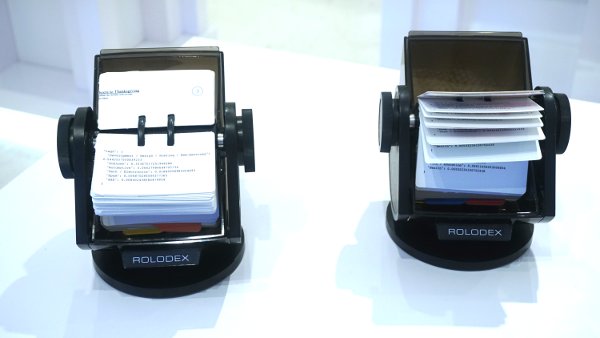
Floodwatch by Office for Creative Research - Jer Thorp
Ever wondered why you are getting those ads for hotels in your vacation destination just after you book your flights there? Or ads for winter boots just after looking at a blog about this season’s fashion trends? Your browsing history is tracked, profiled, shared and sold by online marketeers. Floodwatch, developed by The Office for Creative Research (OCR), is an extension you can add to your Google Chrome browser, that maps the quantity and type of online advertisements that target your unique online profile. As you scroll through each rolodex here, can you guess the profile of the person these advertisements were intended for?

Forgot your password? by Aram Bartholl
Forgot your password? No problem. Look it up right here. In 2012, LinkedIn, was hacked and 4.6 million passwords were leaked. Artist Aram Bartholl put these passwords in alphabetical order into a set of books, for your convenience. Take a look, see if you can find yours and think for a moment about how much we rely on our passwords. How good is yours?
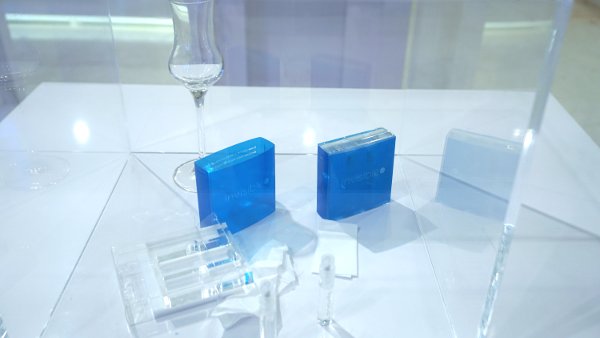
Invisible by Heather Dewey-Hagborg
We often think of data traces in the online world, but what about the data traces we leave behind as we move through physical spaces? Forensic technology has become so advanced that traces of DNA left behind on cigarette butts, chewing gum or loose hairs, can be used to identify your sex, hair and eye color and even your geographical ancestry. Heather Dewey-Hagborg is an artist working on questions of data and DNA. Here she has created a company – Invisible – that makes sprays that allow you to hack, or erase, the traces you leave behind with just one spritz. As we enter an age of biological surveillance, bio-hacking meets cybernetics is no longer science fiction.
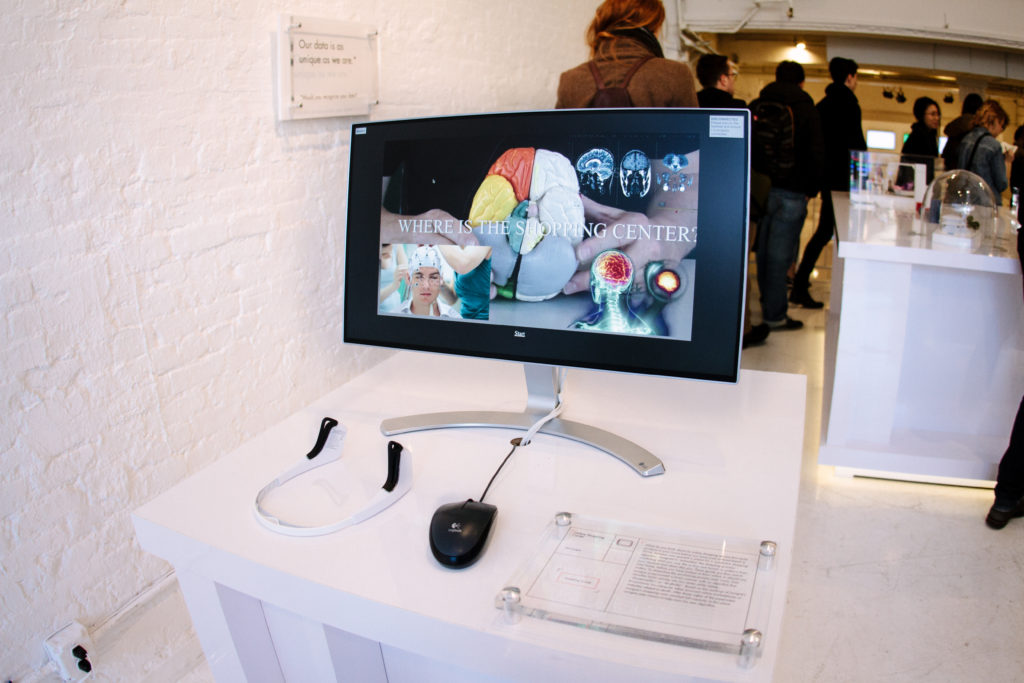
Online Shopping Center by Sam Lavigne
What do you think about an online shopping service that sends products to your home before you have even ordered them? In 2014, Amazon was granted a patent for a ‘predictive shopping’ algorithm, designed to ‘streamline’ the shopping process; predicting what you may like to buy next based on patterns from your account and others like you. These goods are then sent to your home, before you have looked at them online or placed any orders. To streamline the purchasing process even more, Sam Lavigne programmed a brain scanner with an algorithm that classifies brain activity into two states while asleep – “shopping-like” or “death-like”. Based on the readings of Lavigne’s brainwaves, his computer either browsed online marketplaces or websites related to death. After three nights of the experiment, Lavigne’s shopping carts reached full capacity. In this piece Lavigne asks visitors to help train his new algorithm.
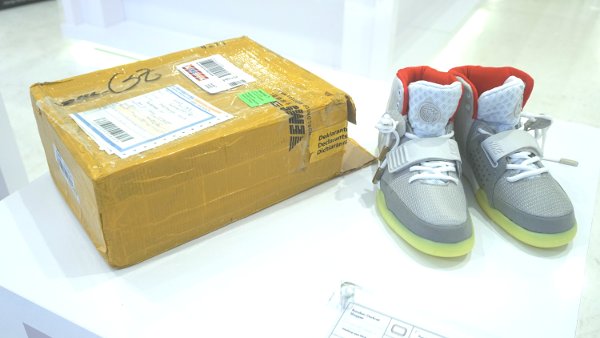
Random Darknet Shopper by !Mediengruppe Bitnik
Random Darknet Shopper is an automated online shopping bot, which randomly purchases one item a week with a maximum budget of $100 in Bitcoins. These items were then mailed directly to the exhibition space where the Random Darknet Shopper was.
In its first run from October 2014 – January 2015, Random Darknet Shopper bought 12 items from the deepweb market, including a Hungarian passport scan, a book on the ‘Art of french cooking ‘ and a baseball cap with a built in spy camera. Here, we are showing purchase No. 7 from 11.05.14 that is NIKE Air Yeezy 2, Random Darknet Shopper bought this fake Kanye West sneakers from China for $75.
At the Data Detox Bar, you can find a simple access point that can connect any user to the Internet via a Tor network. This means that without any special software users can surf the web and access the ‘darknet’.
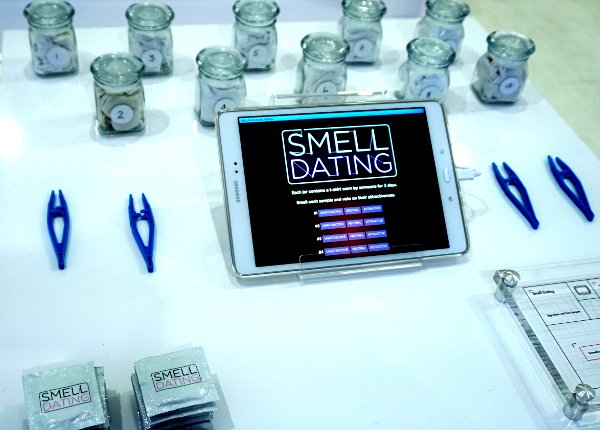
Smell Dating by Tega Brain and Sam Lavigne
Tired of endlessly swiping through the ‘nope’, ‘never’, and ‘not-going-to-happen’? Are you over the back and forth messaging without actually getting anywhere? Online dating apps started out as an exciting way to meet new people, but now the hype is over. Sensory stimulation is the new approach to making connections. Specifically, Smell Dating. This start-up, scent lab and data service developed a scent database that, with the help of participants, matches singles by olfactory compatibility or as it reads on their website, “molecular intuition”. The testing of the service in early 2016 was so successful that it will relaunch in early 2017. Visitors are invited to try the samples from its database of smells and sign up to be informed about the relaunch of the service.
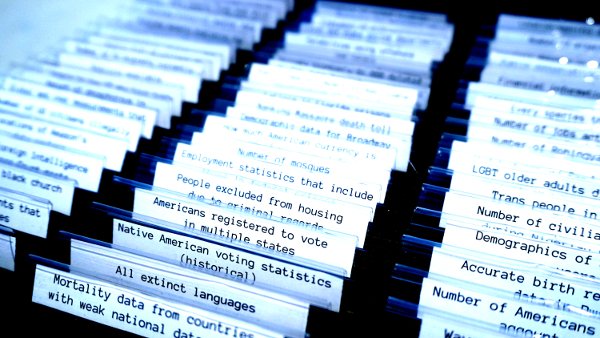
The Library of Missing Data Sets by Mimi Onuoha
Are datasets capable of representing experiences beyond those that create and control them? The ongoing research project Missing Data Sets by Mimi Onuoha is a list of data sets that are missing – datasets that do not exist, but should. Their absence says something about the unquantified side of our lives and raises questions about those things that resist simple quantification. This absence leaves us wondering if there are advantages to ‘non-existence’. Browse through the files of missing data sets. What’s missing and why?
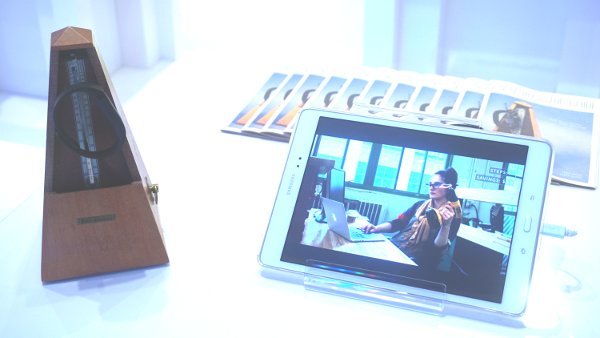
Unfitbit by Surya Mattu and Tega Brain
Who are you really working for when you work out? What your FitBit says about you is vauable information. When you skip the gym or take the elevator instead of climbing the stairs, your health insurer would like to know. But you can free yourself from the pressure of having to always be active with the UnFitbit. Clip your FitBit to a metronome, a drill, bicycle wheel or a pendulum and generate fake fitness data without lifting a finger.

Where The F***k was I? by James Bridle
Your phone can keep your memories much better and for much longer than you can. From June 2010 to April 2011 James Bridle, and anyone else with an iPhone, unknowingly had their locations mapped and saved in Apple databases. Where The F***k was I? is a visual representation of the extracted data, containing all 35,801 locations he visited during this time. Bridle’s publication is a reminder of the permanent memories the devices around us hold.
NORMAL IS BORING
How powerful is the ‘disruption’ of Silicon Valley? Branded as disruptive ‘Un-Companies’, these entities are more precisely major stake holders of power, influence, and wealth. Exhibits at this table explore what is being done with the vast accumulation of knowledge, wealth and power by tech companies and tech billionaires.
All works in this section are by Tactical Tech and La Loma.
The Alphabet Empire
When we think about the slogan, ‘one account all of Google’ just how much information are we sharing, with who and what is it being used for? What was once just a search engine company is now a huge digital conglomerate. It is now one of the worlds largest data collectors, learning about our habits, actions and thoughts to improve its machine learning techniques. Since it was founded in 1998, Google – now Alphabet – has acquired more than 180 companies and invested in a further 400 firms, expanding its services to home security, DNA databases, self-driving cars and the world’s largest library. Based on openly available information, this 3-D infographic combines a quote from its chairman, Eric Schmidt, with a mapping of its acquisitions and investments.
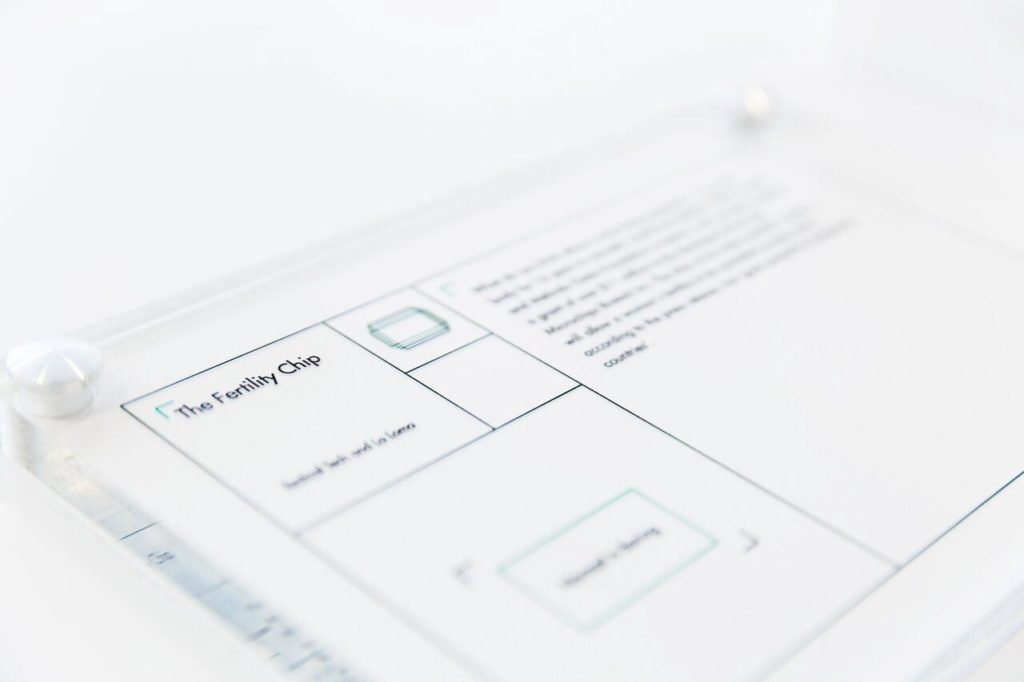
The Fertility Chip
What do you think about a chip being implanted in a woman’s body for 16 years to remotely control her fertility? In 2012, the Bill and Melinda Gates Foundation started investing in such an idea, by giving a grant of over 11 million dollars to the developers of this chip, Microchips Biotech, Inc. The chip to be made available in 2018, will allow a woman’s fertility to be controlled remotely which, according to the press release, has ‘great potential for developing countries’.
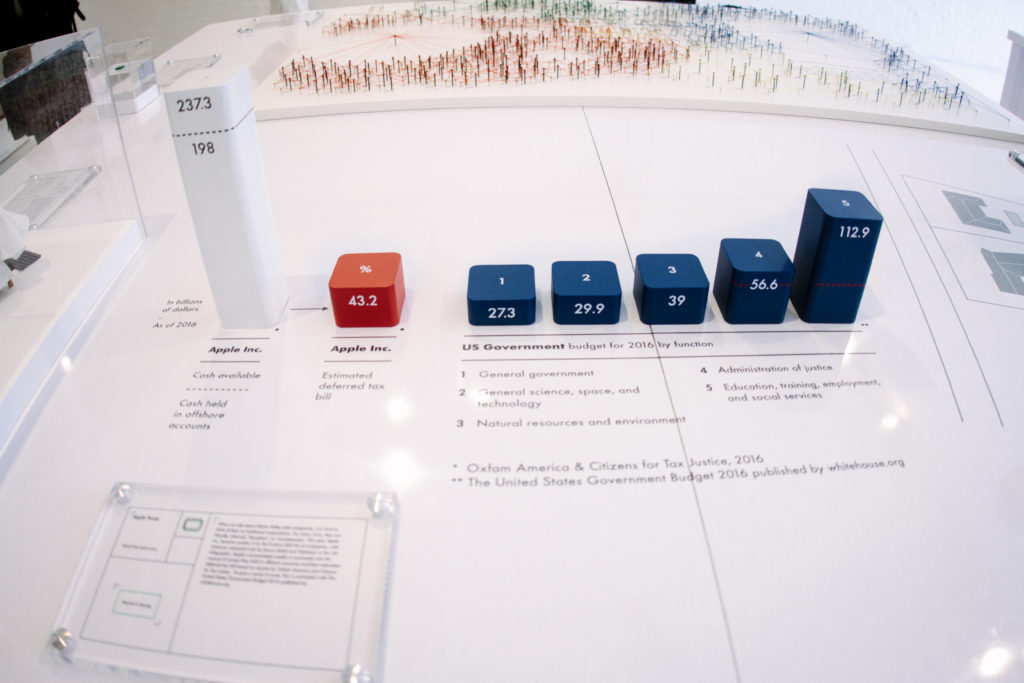
The Apple Tower
This year, Apple Inc. became number 3 on the Fortune 500 behind only Exxon Mobil and Walmart. This 3D infographic contrasts its wealth accumulated in offshore accounts and the company’s deferred tax bill with the 2016 federal budget for the US Government.
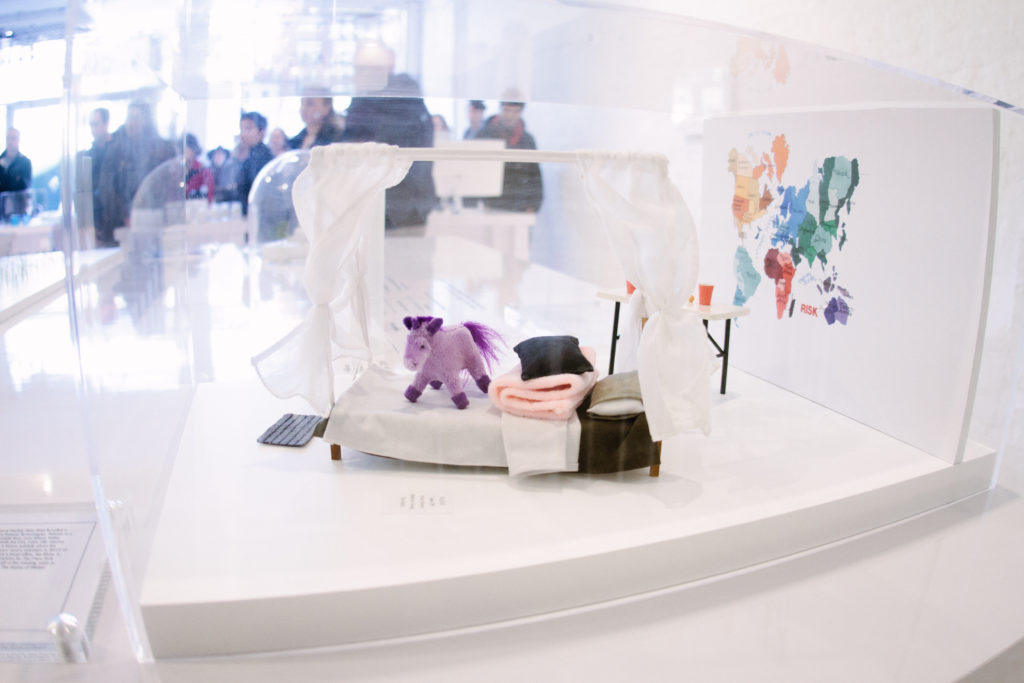
The Unicorn
Based on technology developed at PayPal, Peter Thiel founded a data-analysis company known as Palantir Technologies. Palantir is a start-up with a different business model than most Silicon Valley companies and its main clients include the CIA, NSA, FBI, Marine Corps and the Air Force. Very little is known publicly about the company despite its status as a ‘Unicorn’ and a valuation in 2015 of 20 billion dollars. This model of Palantir’s head office, the Shire is based on photographs taken by Peter DaSilva for The New York Times in 2014. The world map on the wall of the meeting room is based on the strategy board game “Risk: The Game of Global Domination”.

The Zuckerberg House
In 2010, Mark Zuckerberg – the founder of Facebook – claimed the age of privacy was over. A couple of years later, Zuckerberg paid over $40 million to buy the four houses that surrounded his own $10 million home in Palo Alto. He also asked construction workers and interior designers working on the house to sign non-disclosure agreements before starting renovation. This model of his house was created using images from Google Maps. What will be the real cost of privacy in the future and who will be able to afford it?
BIG MAMA
A comprehensive look into the modern state’s reinvention of itself as the e-government or digital agency. Objects here demonstrate institutionalized methods of data observation, tracking, pattern recognition and its adaptation to governmental operations from national identification to refugee aid. Dressed up as care, Big Mama takes these precautions because “it’s for your own good”.
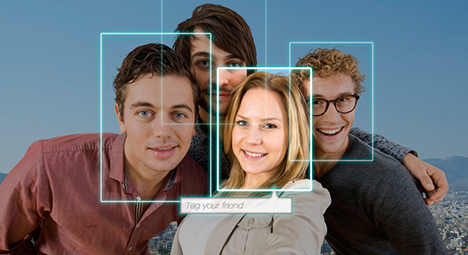
DNA Phenotyping, Presented by Heather Dewey-Hagborg
Parabon Snapshot produces facial profiles from DNA samples. The software takes complex genetic data–such as that found at a crime scene–and from it infers ancestry, appearance and kinship. This is done by mining vast genetic data sets for the DNA markers associated with specific traits, such as skin and hair color or ancestral geography. The software then produces a graphic image of a person that it projects matches the DNA. The company targets its service at law enforcement to help investigate cases which have no known suspects or unmatched DNA evidence.
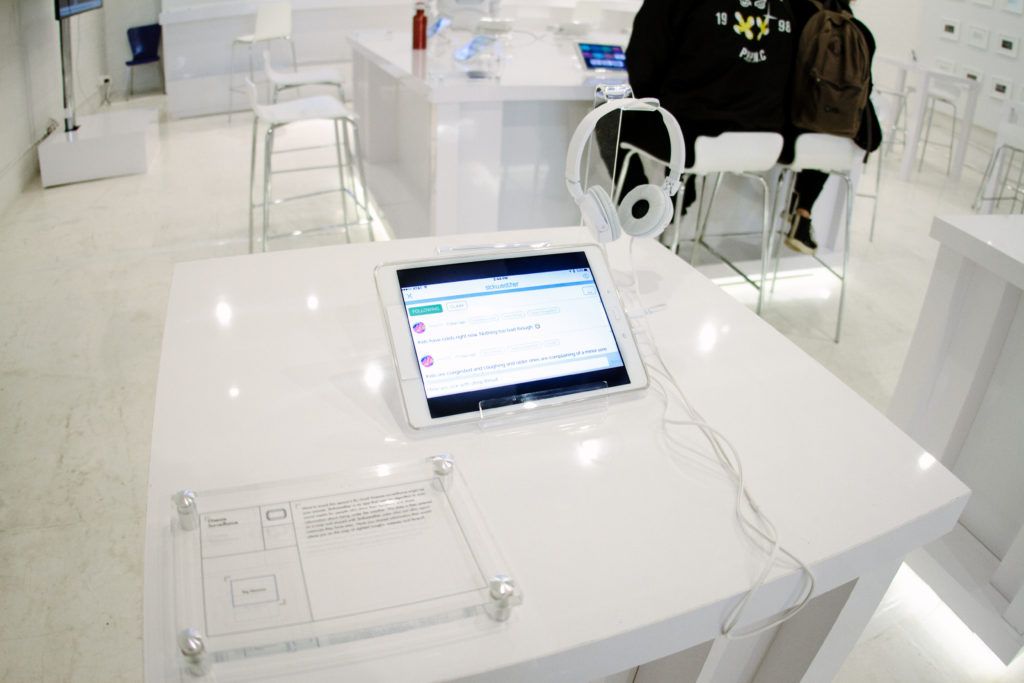
Disease Surveillance
Want to avoid this season’s flu virus? Disease surveillance might be your answer. Sickweather is an app that uses an algorithm to scan social media for people who show their locations and share information about being unwell. This data is then entered on a map and shared with Sickweather users who can also report instances they have seen. Would you find yourself on the map of sighted coughs, sneezes and fevers?
Facial Recognition for Churches
Churchix uses facial recognition software to track church attendance. It helps church administrators to monitor members of their congregation and participation in church related events. This is an instructional video showing how to train the software to recognise members of a congregation in a video or livestream. Face Six, the company behind Churchix, uses similar software for products used in casinos, airports, and at border control.
Iris Scanning
This promotional video illustrates how iris scanning – the unique identification of individuals through the iris patterns in their eyes – to enable refugees to access cash from ATMs or shop in partner supermarkets. According to IrisGuard, the company who makes the technology, more than 1.6 million refugees in the region have been registered on their biometric database. IrisGuard has three advisory board members: the Founder, Chairman, and CEO of a global merchant bank, the former Head of the British Secret Intelligence Service (MI6), and the former Homeland Security Advisor to the President of the US.
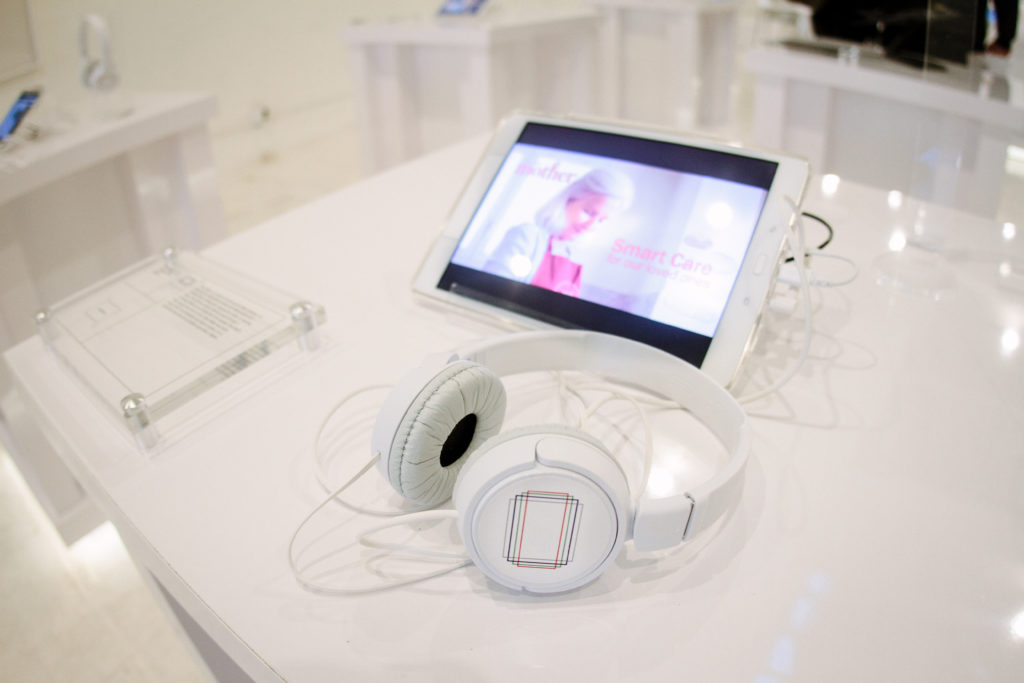
Monitoring Solutions For Seniors
Silver Mother is a product for monitoring the elderly remotely. As a subscriber you will be able to monitor your elderly parent 24/7, checking if they are taking pills, changing their habits, or receiving visitors. The subscriber receives continuous reports through a monitoring dashboard and mobile alerts if for example, there hasn’t been enough water drunk in a day. Silver Mother uses motion sensors which can be attached to any device or person, it is a product that closes the circuit of cradle to grave data collection.
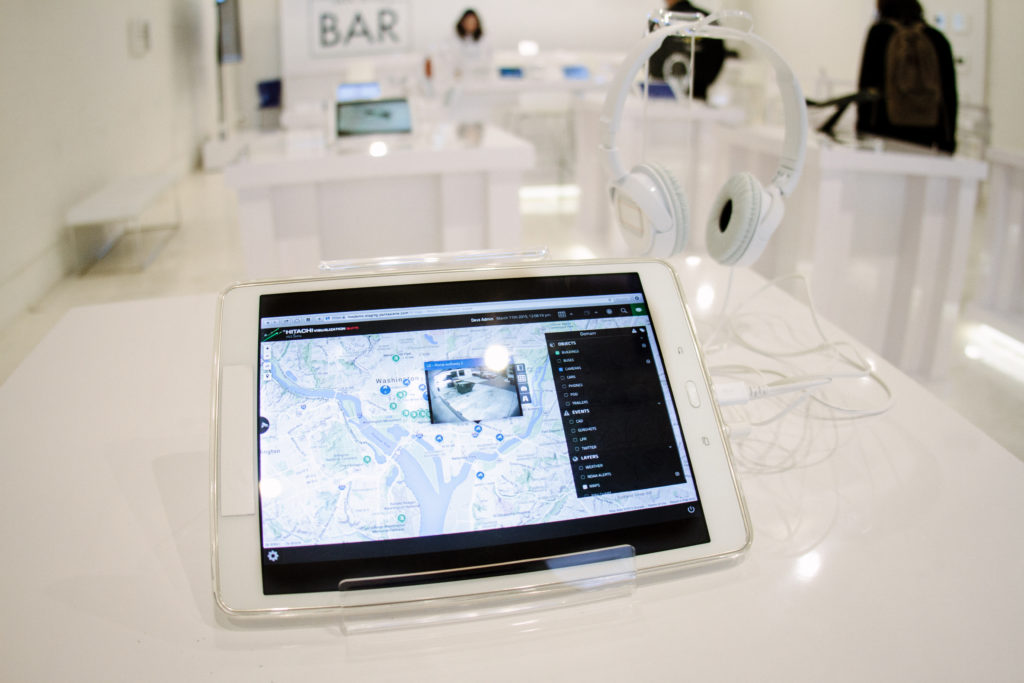
Predictive Policing
Could technology help us predict future criminals, or perhaps even future victims? Predictive policing aims to do just that and is increasingly being used in the US. Despite controversy around the prejudices it can reinforce, it is mostly sold as technology that ‘makes policing cheaper’. The software ranges from tools like PredPol, which maps crime by looking at geographies and histories of crime, to Hunchlab which combines historical data of crime with other variables like the weather and Hitachi’s system, featured here. This software, Hitachi Visualization Predictive Crime Analytics (PCA), aims to reduce bias in past crime data by introducing other data sources such as social media. Hitachi’ claims social media data increases accuracy by up to 15%, in particular because of a machine learning technology they teach to look for unusual phrases in what they identify as ‘gang’ social media communications.
Sociometric Badges
‘People analytics’ is about gathering information on the social interactions of employees in the workplace. Who talks with who, where and how often? This sociometric badge Humanyze, collects this metadata (not the content of these conversations but their occurrences), which can then be correlated with the data generated by the digital communication in an organization such as email, calendars, chats, and location data. When uploaded to the cloud, the collected data is analyzed to measure whether teams are structured for optimal productivity and innovative potential. The results are presented in aggregate as easily digestible, actionable insights for the organization’s decision makers. According to the makers of Humanyze, employee IDs with built-in sensors and internet connectivity will be the norm of future workplaces.
The Interfaced Boarder by Joana Moll
Texas Virtual BorderWatch was a public-private initiative designed “to empower the public to proactively participate in fighting border crime”. The platform consisted of a network of 200 cameras and sensors located along the US/Mexico border and an online platform called BlueServo. The site gave free access to the cameras’ broadcasts 24/7 and allowed the users to report anonymously if they noticed any suspicious activity on the border. BlueServo had over 200,000 volunteer users since the platform was launched in 2008, representing almost 1 million hours of free labor for the Sheriff. The program stopped in 2012 due to lack of financial support, as announced in its official Facebook page on May 13 th 2012. The Interfaced Border by Joana Moll re-creates some of the elements found in the publicly accessible BlueServo’s online surveillance interface.
The US Census
In 2000 and 2010 Lockheed Martin was contracted to collect and process census data for the US. In the following years, it also became the contractor for the census in Canada and the United Kingdom. Lockheed Martin is America’s largest global aerospace, defense, security and advanced technologies company. It makes fighter planes, cluster bombs, combat ships and nuclear weapons, and works on surveillance and information processing for the Pentagon, the CIA, the NSA and the FBI.
OUT OF THE BOX
Have you ever wondered what your data looks like from the other side–what cellphone providers, internet providers or websites can see about you andy our preferences and habits as you use their services? If so, take a look at these short, soundless animations showing a bird’s eye view of what data is collected, by who and how. Some of the animations look at the data traces we leave behind when we use digital devices moving around the city or a physical space, some look at how our work and life patterns can be seen from our online data traces as we browse the web,send emails or use social media sites, and others look at how our data is bought, sold, analyzed and utilized and how it begins to shape the societies we live within.
Citizen X: Who are you based on your browsing?
Project by James Bridle, animation by Tactical Tech
Every time you go online, you travel through servers in different countries and jurisdictions. These virtual journeys are tracked and your data, accurate or not, is stored across the world. Citizen Ex is a browser plugin for Firefox, Chrome and Safari that reveals your ‘Algorithmic Citizenship’; or in other words how you are seen to others without them knowing who you actually are. This creates a hybrid of nationalities and different legal rights based on where you travel online.
Confessions Of Data Broker: How do data brokers work?
Project by Tactical Tech, Animation by Tactical Tech
Who are data brokers, what is the value of your data to them and how do they operate? This animation shows some of the findings from Tactical Tech’s anonymous interviews with data brokers. In these off-the-record interviews, data brokers talked about who they buy data from and how, which data is garbage and which is gold, and how our data is turned into cash for a multi-billion dollar industry.
Data Anonymization: Is anonymization possible?
Animation by Tactical Tech
How many times have companies claimed that they will anonymize your data? Anonymization is promising us privacy and makes us believe that it is ok to give our data away. This animation looks at recent research on how anonymization and deanonymization works through one story of yellow cabs in New York city and asks if such promises are sufficient.
IC Watch: What insights can you get from LinkedIn?
Project by IC Watch, animation by Tactical Tech
We all use social networks to connect with people and create new opportunities; finding new jobs, getting new clients or building new business relationships. Doing so requires us to share a lot of information about our personal and professional lives to a broad range of people that we will likely never meet. This visualization, focuses on what LinkedIn can show us about a sector, in this case the intelligence community. Overall, it shows what can happen when information which is published for one purpose gets used for another.
Inside Hacking Team: What does your email reveal?
Project by Sharelab, animation by Tactical Tech
We often hear about metadata – that is, for example data that may describe what we are doing, with who, when and where. This visualization looks at the emails of one organization and shows what we can learn by looking only at metadata generated by sending and receiving emails. This is a part of your information that you often aren’t aware of, but it creates a detailed picture of the organization, its dealings, social networks, and internal communications and relationships.
Living with Algorithms: Why should you care about algorithms?
Animation by Tactical Tech
‘Algorithm’ is a buzzword that is used to explain everything from big data to machine learning. This animation unpicks why we should care about algorithms and how they effect us every day. It looks at them outside of the computer and within our lives and asks how much can we rely on the past to predict the future.
Re:Log: How invisible are you on WiFi?
Project by Open Data City, Animation by Tactical Tech
Whenever we can, we join free wifi networks to get online when we are on the move. This animation based on the data gathered from a conference held in Berlin, Germany in 2013 shows what an operator of these communication networks can see, what they can learn about who is in the space, and how they behave.
Serious Profiling: Have you been profiled yet?
Animation by Tactical Tech
Do you have one profile or many? Are you in control of your profile? This animation looks at the ways in which our online identities are created based on our actions online and offline and how they are used by the data industry. As our profiles become more valuable, it also looks at the new clients for these profiles; finance, insurance and political parties.
The Monitored Life Of National Councilor Balthasar Glättli: What does your smart phone say about you?
Project by Open Data City, Animation by Tactical Tech
As we go about our daily lives we generate all kinds of information through our smart phones and hints at the kind of insight available into a person’s actions, habits and life patterns.
Some of this we know about, such as our phone calls, our location and perhaps even the emails we send, however we are usually unaware of how much our devices are sharing information about our movements, habits and social networks. This visualization shows intimate knowledge of a Swiss politician’s calendar, professional engagements, family life, physical movements and social media habits. It also reveals the sheer volume of information that digital devices collect and transmit.
The Scoring Society: What is your online score?
Animation by Tactical Tech
From Dave Eggers The Circle, to Charlie Brookers Black Mirror, fictional writers are beginning to paint a nightmarish scenario for us of the ‘scoring society’; a neurotic world in which we are constantly rated through endless feedback loops and random point systems. This animation looks at scoring applied to our lives, from Credit Scoring to Social Media Scoring and Terrorist Scoring.
Trackography: Are you tracked reading the news?
Project and animation by Tactical Tech
Wherever you browse, someone is looking over your shoulder. Almost every website visit is tracked by someone, somewhere and the data is not only collected by the website you visit, but also shared with and sometimes sold to others. When we browse the web we are not only consuming information, but we are also producing information about who we are and what our interests are. Trackography – an interactive visual tool based on over 2000 news websites from 38 countries – reveals who these trackers are, and who is reading you as you read the news.
You Never Read Alone – cookies, trackers – where do they take our data – who aggregates it? (based on work by Claudio Agosti)
DATA DETOX BAR
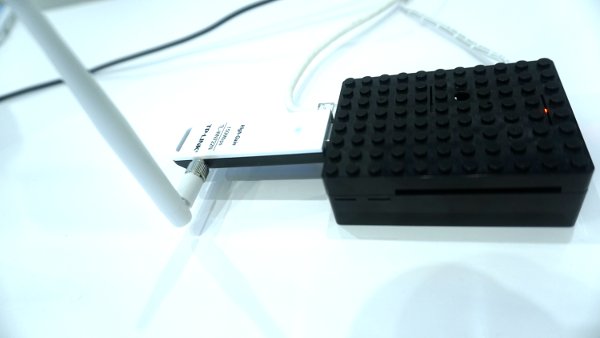
Here at the Data Detox Bar you are invited to explore the inside of the online world. Use Floodwatch to get the feeling of being a data broker and manipulate someone else’s online advertising stream. Play with Newstweek to create your own fake news – edit your own version of the New York Times or USA Today. Or, if you want to see deeper inside the web, visit the dark net, courtesy of !Mediengruppe Bitnik. You don’t have to install anything, just connect to the access point BTNK_TOR_STATION.
Too shy? not convinced? Talk to one of the Ingeniouses behind the bar, they can show and tell you much more. Or, ask them about our ‘data detox kit’.
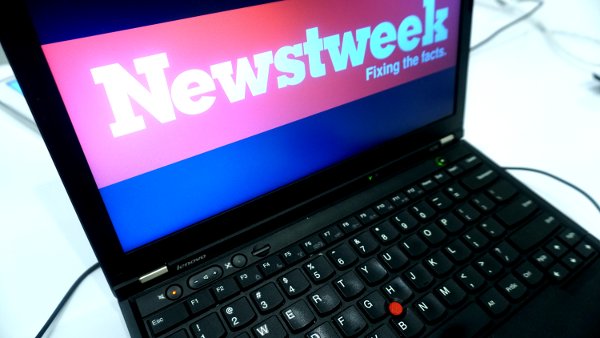
Newstweek by Julian Olivier and Danja Vasiljev
Do your friends and colleagues complain that media coverage is too boring/depressing/celebrity-laden/happy? With the Newstweek, you can be a master of digital headlines. Have fun manipulating facts and public opinions wherever you find an open wireless hotspot.

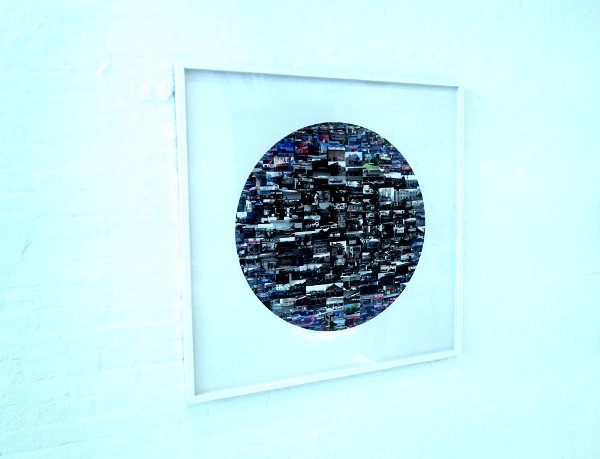
Information of Note by Josh Begley
Information of Note is an installation comprised of text and photographs that were extracted from NYPD Demographics Unit records that profiled Muslim-owned or affiliated businesses, gathering places, and sites of worship. Each location entry includes: a photograph of the exterior; location.
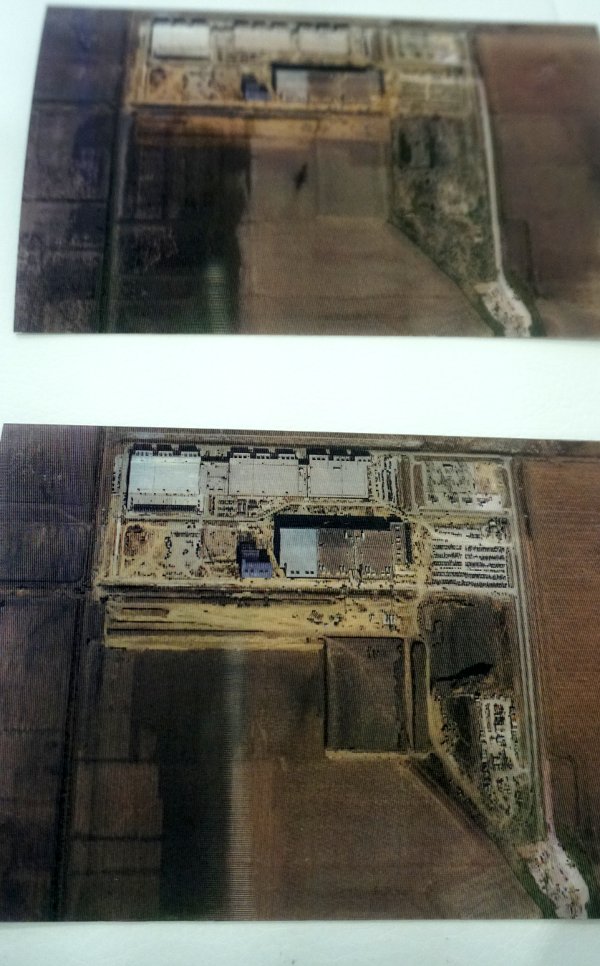
Reconnaissance, Lenticular Postcards by Ingrid Burrington
A birds eye view of several politically relevant locations are fully visible when shifted from side to side in this series of lenticular postcards by Ingrid Burrington. The satellite images of data centers, military sites, and downlinks were captured at two points in time to map the spaces in transition because there is no definitive view.

Unintended Emissions by Bengt Sjölén & Julian Oliver & Danja Vasiliev
As you make your way around the city each day you are constantly emitting data from your devices and being filmed on closed circuit TV (CCTV). The Critical Engineering Working Group is using radio receiver like technology to passively scan the exterior sidewalk on Mulberry Street for device signals, and then shows the data traces of pedestrians passing by The Glass Room in real time. The devices shown live on the screen are detected and located by ‘unintended electromagnetic emissions’, otherwise known as ‘data transmissions’. They are then represented here, creating a kind of live stream of data passing by.